
Profiling Python Code: Best Profiling Tools You Should Know
•6 min read
- Languages, frameworks, tools, and trends

Have you ever wondered how every software has a certain speed for performing your task? Well, that’s possible because coders keep testing and improving the software for efficiency.
To do this effectively, they use code profiling. In simple terms, profiling helps determine the speed and accuracy of each function.
And Python, being a language that supports so many functions, has its own set of bugs and errors. There might be some syntax that takes a long time to process results or a code that is too complicated, which can impede user experience. Hence, coders are constantly testing and running the software to determine those lines or blocks of codes.
Every program developed on Python is tested with the help of Python profilers for the speed and complexity of functions. You might be wondering, what is that? How can it be used?
Through this post, I’ll be telling you everything you need to know about code profiling and Python profilers. But before I jump into that, let me tell you a bit about code profiling.
What is code profiling?
Code profiling is analyzing which code is utilizing the maximum memory of the program or is too complex to process. Code profilers are the tools that help expedite this process.
For example-
line_profiler (to measure detailed execution time)
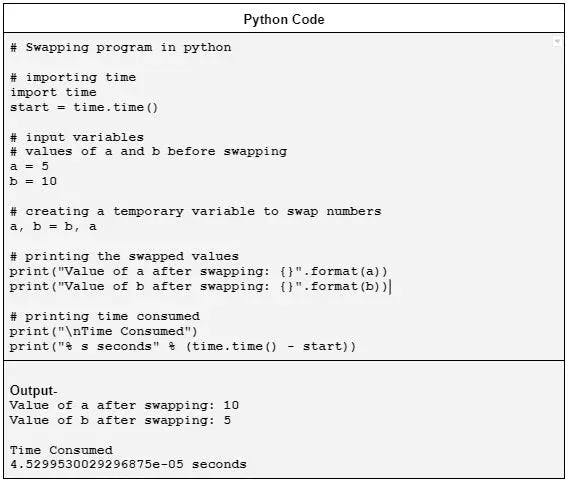
time (to measure execution time anywhere in the program)
Python Code Showcasing Time Profiling
Profilers collect various data pertaining to performance issues with techniques such as instrumentation, hardware or software interrupts, operating system hooks, and so on. The instrumenting could be a source or binary instrumentation.
This profiling information helps in the performance optimization of a program developed using languages such as Python, Java, etc.
Now, let's discuss how this task is achieved in Python.
Top 6 Python Profilers of All Time
Similar to code profiling, python profiling helps coders in finding the hot spot of a program and rectifying it to improve any program's performance. At times, this hot spot can reveal a bug that needs to be fixed.
This is done with the help of Python profilers, which help in providing deterministic profiling of Python codes. Here are some of the best Python profiling tools you should opt for.
Timeit
While there are multiple ways to perform the same function in Python, you may want to check the one that can be most effective. Timeit is one such profiler used commonly for individual lines or blocks of code.
It takes a code snippet, runs it several times, and provides the total time it took. However, this module only works if you are working with code in isolation.
For working with this approach, one needs the following information:
- The total run time of the program to calculate the relative run time of the function under test.
- Deep detail about the issue or the runtime of the other parts of the program before labeling the function being tested as a block.
The only downside of Timeit is that it can only be used to test individual lines or blocks of code.
cProfile
cProfile is a built-in python module and is the most commonly used profiler. This profiler traces every function call in your program, and lists out the ones called most often and how long they took on average.
Some major advantages of the cProfile module include its presence in the standard library, listing detailed statistics about the call behavior, and turning on profiling for select functions only.
- Some other advantages of cProfile include:
- Provides the total run time taken by the entire code and each line.
- Detail out the number of times a specific function has been called.
- Easy export of data.
- Can be visualized using the snakeviz module.
Now, looking at its downsides, it generates a lot of statistics by default and traps every single function call.
Palanteer
Palanteer is relatively new to Python profiling tools. It tracks a wide range of parameters ranging from function calls to OS-level memory allocations.
Also, it can profile both Python and C++ programs, which is useful when you write a Python application that includes C++ libraries.
Besides, it displays the results in a separate GUI app that runs on the desktop. And, as the program runs, it gets updated on the app. So you can track and visualize the stats on the go.
However, this profiler's only downside is the lack of precompiled binaries, so it must be built entirely from the source.
The syntax for Palanteer profiling and monitoring is similar to cProfile
Pyinstrument
Similar to cProfile, but offers more advantages as it doesn’t record the entire function call stack at once. It rather does this every 1s to reduce the profiling overhead.
Also, it eliminates the faster segments and, in turn, the profiling noise. Therefore, it shows only the functions taking max time. The only issue with this profiler is that it is not effective for codes that run in multiple threads.
PyCharm
PyCharm is one of the best Python Profiling applications you will ever come across. It is an Integrated Development Environment (IDE), developed by JetBrains for Python.
PyCharm profiling helps coders with code analysis and completion, highlighting errors, unit testing, VCI (Version Control Integration), and such likes. Additionally, it supports web development with frameworks like Django and Flask.
One of the best features of PyCharm is that it provides an API to developers for writing their plugins and extending their functionality.
Yappi (“Yet Another Python Profiler”)
Yappi is a Python profiler designed in C. It supports function-level profiling and profiling of multithreaded codes. And for profiling output, it supports multiple formats, including callgrind and pstats.
Besides, it also provides the ability to decide whether you want to profile the CPU time (time taken by code to use CPU) or the wall time (time during which the code ran). Where wall time just acts as a stopwatch the latter clocks via system native APIs.
With Yappi, you can also perform these operations-
- Filter the results, sort them, invoke, start, stop, and generate profiling reports.
- Profile greenlets and coroutines, which is not possible with most profilers.
Conclusion
It’s no secret that every program has specific bugs. It may be because of syntax errors, code complexity, or other factors. And every coder works round the clock to find and debug those issues.
Python is one of the most loved languages among programmers, considering its edit-test-debug cycle is amazingly fast. Plus, it is easy to learn and understand. That’s why it is used to create vivid categories of software and websites.
But, as I said, no technology is flawless. The products built using Python are no exception. To make them seamless for users, coders take the help of Python profilers and eradicate those lag-causing factors.
We have mentioned everything you need to know about prominent Python profilers in this post. It’s time for you to take a cue from it and start finding the codes causing a lag in your product.
If I’ve missed anything, please reach out to me in the comments. Till then, happy coding.