R Programming: Using the ANOVA Test for Statistical Computing
•8 min read
- Languages, frameworks, tools, and trends

ANOVA test or analysis of variance is a statistical test to evaluate how a quantitative dependent variable is affected by other individual variables. In simpler terms, it’s a form of hypothesis testing for variance in a given group or groups. This article will discuss the one-way and two-way ANOVA tests in R programming, why they are useful for statistical computing and analysis, and how to perform them.
Understanding the concept of ANOVA
ANOVA determines whether groups created by levels of an independent variable are statistically different by comparing means of the treatment levels with those of the overall dependent variable. This means that if the mean of any group vastly differs from the overall mean, the null hypothesis is immediately rejected.
An ANOVA test requires us to set up two different hypotheses. These are:
- Null hypothesis: This suggests that means are identical between groups.
- Alternate hypothesis: This suggests that one or more group means are different.
For impartial statistical significance, ANOVA uses the F-test which enables multiple means to be compared at the same time because any errors are calculated for the entire dataset.
In situations where the variance within groups is smaller than that between groups, the F-test will result in a higher F-value and, therefore, a greater likelihood that the difference observed is real.
Here are a few things to keep in mind.
1. Data and variable assumptions
There are a few steps to remember when gathering data and setting up parameters for the test:
a. The observations are drawn at random from a population characterized by factor levels.
b. For each factor level, data is distributed normally.
c. All populations within the dataset have a common variance.
The common variance in a dataset can be authenticated with a Levene’s Test.
2. Data collection
Before running a one-way ANOVA, we need to make sure we have sufficient data for one categorical independent variable and one quantitative dependent variable. We also need to ensure that there are at least three different categorizations or levels.
In this scenario, we are collecting data about three different car brands and finding out how many people own which brand of vehicle in a given area.
Setting up R programming
If this is your first time using R programming, get R and R studio and install both of them.
Now, open R Studio and select File>>New File>>R Script.
The next step is to install and load all the packages needed to perform an ANOVA test. This only needs to be done once using the code below:
After this, you need to load another set of packages that have to be loaded every time you restart R. The code is as follows:
Now, load the dataset you wish to use onto R.
Since the article covers both one-way and two-way ANOVA tests, begin with one-way and consider the independent variables needed to execute the command.
For this, you can use the read.csv() command which will import your dataset into R to be used for various purposes.
The code is as follows:
Here, xxxx is the name of your dataset. path/to/file needs to be replaced with the actual path on your system.
Now, run a quick check to see if all the data is as it should be by running the summary() command:
summary(xxxx.data)
Make sure the imported data reads as it should.
How to do ANOVA tests
Before exploring the how-to’s of performing ANOVA tests, here’s a look at the differences between one-way and two-way tests.
One-way ANOVA test
As the name indicates, the one-way ANOVA test takes into consideration one categorical group.
Essentially, the data provided is sorted into various groups but is based on a single common variable called the factor variable.
Let’s move on to the first step.
The dataset will contain the following information:
a. Brand Name
b. Number of Owners
Since this is a one-way ANOVA, there is no need for additional considerations apart from these two.
Let’s go ahead and load the dataset into R programming with the aov() command:
In the command above, car.data is the dataset that will be used. This can be any dataset that you wish to use for the ANOVA test.
The owners, which is the difference in the mean of the response variable, is a function of the brand.
Use the summary() function to summarize the data:
summary(one.way)
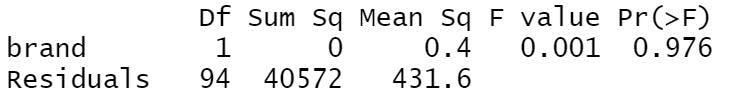
Let’s understand what the summary tells us.
The independent variable here is brand since we only have one variable for this test along with the model residuals which simply refers to the model errors.
- DF: Refers to the degree of freedom for independent variables which is calculated by subtracting 1 from the total levels, as well as residuals which are calculated by subtracting 1 and the total number of levels with the total observations.
- Sum Sq: Refers to the total variation between overall and group means.
- Mean Sq: Refers to the mean of Sum Sq which is calculated by dividing the sum of squares by the degrees of freedom.
- F-value: Refers to the mean square of independent variables divided by the mean square of residuals. In simple terms, it is the test statistic from the F-test. If the value is larger, the chances of the independent variable being real is higher.
- Pr(>F): Refers to how likely the F-value being calculated would occur if the null hypothesis is true.
Finally, depending on how high or low the P-value of the summary is, we will be able to understand what impact the independent variable had on the final result.
Now, let’s increase the number of independent variables and learn how to execute a two-way ANOVA test.
Two-way ANOVA test
In a two-way ANOVA test, there is usually more than one categorical group. In this case, we are looking at not just how many of the car brands are owned per 100 people in an area, but we’ll also take a look at how they’re affected by service centers in those specific areas.
For this dataset, we will have the following information:
c. Service Centers for each brand
We can run the ANOVA test like before. We need to make sure we’ve loaded in the dataset and proceed to the command below:
Once the code is run, we can summarize the results with summary():
summary(two.way)
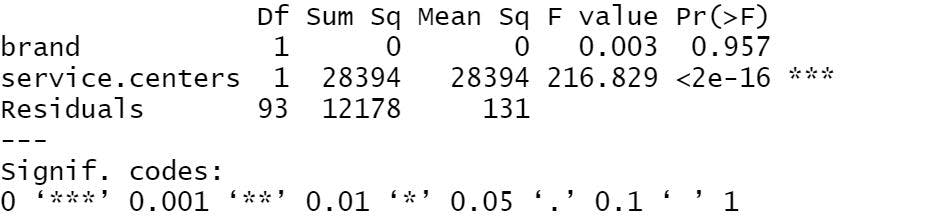
As we can see, the more categories are used to run the variance test, the more accurate the results are.
This can be seen in the residual value being lower than the one-way test. Notice that both brands and service centers together are statistically significant since the p-values are greater than 0.001.
We can also test if our independent variables undergo an interaction or additive effect. To do this, we simply replace the plus sign with an asterisk:
If the summary results show a low Sum Sq and high P-values, there isn’t a tangible variation caused by the independent values interacting.
If there are independent variables that you think might cause a confusing effect among the other variables, add them as a blocking variable using the plus sign with block referring to any external variable outside brands, service centers, and owners.
summary(blocking)
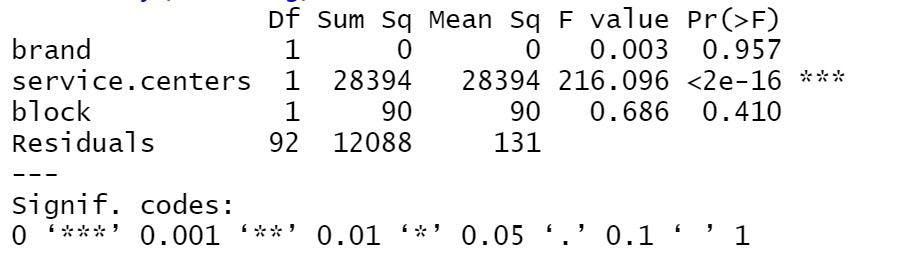
If the output has a low Sum Sq and high P-values, the blocking variable isn’t doing much to cause a deviation. However, if the opposite is true, there will be anywhere from a slight to massive deviation in the mean values.
Performing Tukey’s HSD test
Whether you run a one-way or two-way test, ANOVA only tells you that a difference between group means exists. It does not tell you what those exact differences are. However, Tukey's HSD (honestly significant difference) test can help you understand which groups are statistically different.
To perform this, use the code below:
For one-way ANOVA,
For two-way ANOVA,
Once this is done, the results will first report the model being tested. This is known as fit. It will also include pairwise variations between groups for the various independent variables.
Additionally, it will show the mean difference between each car brand along the lwr (lower) and upr (upper) limits of the 95% confidence interval.
Once you have reached a conclusive result with your tests, it’s time to report the findings.
Result report
For all reports, it’s important to mention the variables being tested, the degrees of freedom, f-values, and p-values for every independent variable. Explain the results in brief as well.
If required, you can provide a graph for a more visual representation of the ANOVA test results.
This can help you understand the results far easier when compared to the direct results, which can be overwhelming if a large amount of data and variables are involved.
While the ANOVA test has many applications in the real world, it primarily comes down to the dataset you are using for the test and the independent variables that exist within the dataset.
Similarly, even if the dataset is large, there are situations where you can break the independent variables into multiple different ANOVA tests and, finally, use MLE (maximum likelihood estimation) to further simplify the results.
FAQs
1. How is statistical significance calculated during an ANOVA test?
Ans: The null hypothesis in ANOVA is that there is no difference between group means. This means that ANOVA reports a statistically significant result if any group differs significantly from the overall group mean.
2. What is factorial ANOVA?
Ans: Any ANOVA test that has more than one categorical independent variable is a factorial ANOVA. Simply put, a two-way test is a type of factorial ANOVA.
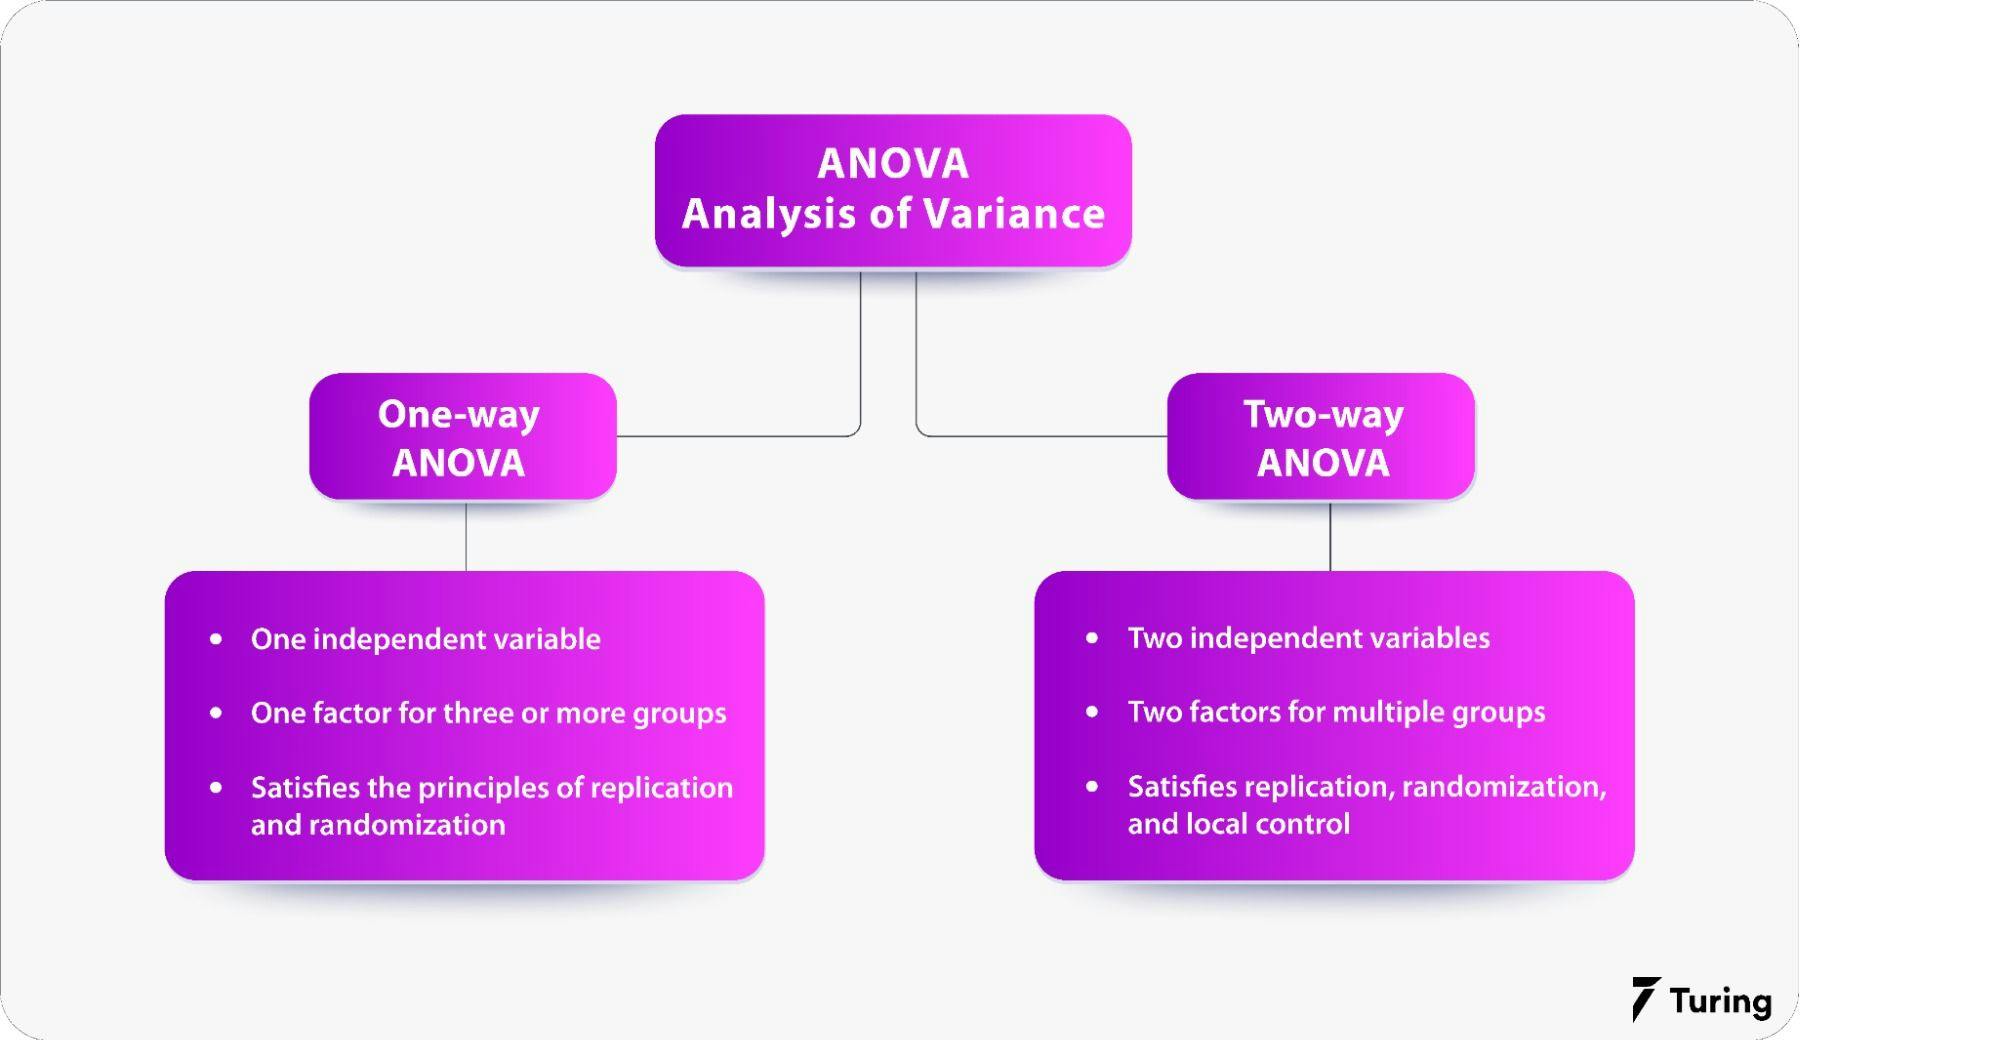
3. What is the difference between one-way and two-way ANOVA?
Ans: The main difference between both tests is the number of independent variables. As the name suggests, the one-way ANOVA test has one independent variable, while the two-way ANOVA test has two independent variables.