
How to Build an Interactive Dashboard in Python Using Streamlit?
•9 min read
- Languages, frameworks, tools, and trends
- Skills, interviews, and jobs

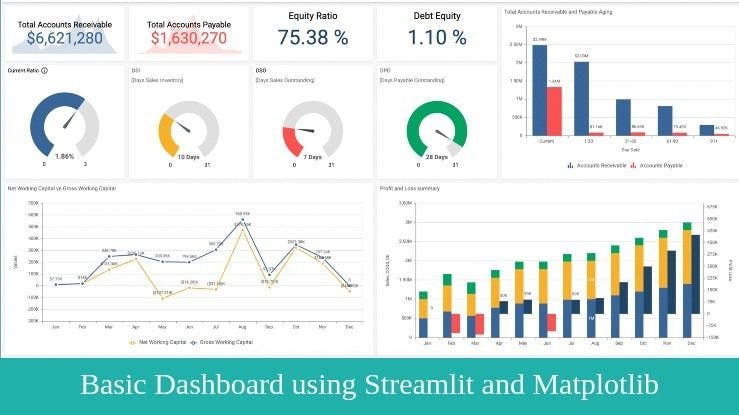
A Streamlit Python interactive dashboard helps in better understanding your datasets. The dashboard will evaluate the dataset results and make necessary changes. Unlike having a simple number format for the reports, the dashboard will provide visual reports to enhance your understanding of the dataset.
In layman's terms, Streamlit is an easy way of creating an effective, explanatory, and efficient dashboard. It is an open-source web application framework that helps researchers to investigate and gain a proper understanding of the datasets with a good and interactive dashboard.
When you are working with Streamlit, you don’t have to worry about your front-end knowledge. Streamlit framework will easily convert data scripts into a shareable web application with just a few lines of coding. In this article, we will learn about Streamlit and how Python developers can use it to build an interactive dashboards.
Advantages of Streamlit
Streamlit helps to make a deployable and interactive website application without any knowledge requirement of CSS or HTML. Streamlit will automatically refresh your website applications whenever there is a change in the source codes.
There are many visual libraries available that Streamlit supports when you want to build interactive dashboards such as Altair, Plotly, and Bokeh. You can evaluate the dashboard using a bar, line, or pie chart, which will make it simple and interactive.
What is a real-time live dashboard?
A web application that people can use for displaying Key Performance Indicators (KPIs) is known as a real-time dashboard. When you want to build a dashboard to monitor the stock market, AI training model, or anything else with streaming ongoing data, this dashboard will be very helpful.
Installation
Before beginning a project, we should install the Streamlit website application framework. Just run the below command in the command prompt.
pip install streamlit
Once you have finished installing Streamlit, you should check further to see whether it was successfully installed or not. You can do this with the following command.
streamlit –version
When you’re done with the basic installation step, you can run your first program using the below command.
streamlit hello
Once you run this command, you will require access to it. Click on the Allow Access button for the same.
You will then get a Local URL on your command prompt. It will ask for your email address. You can skip it for the time being and press open, or you can put your email address for future technical support.
The window will open in the web browser on your local system. You can choose the demo to get a better understanding of the Streamlit website application framework. If you want to Close or Quit your running application, you can press Ctrl + C.
Approach
We will now discuss the procedure to approach the interactive dashboard in Python. We can create an explanatory dashboard using the Stroke Prediction Data Set. There are different ways to display images, text, and maps. With Streamlit, you can give some functions for writing headers, titles, and markdowns.
Below are the functions and their descriptions:
- title() - for setting the title
- markdown() - for displaying some text as Markdown
- text() - for writing a description for any image or topic
- latex() - mathematical expressions available on the explanatory dashboard
- sidebar() - for creating a sidebar on the dashboard
- map() - for displaying a map
The above are the functions that are commonly used.
Let’s take an example to understand this better. We can create three chart types: Bubble, Line, and Bar Chart. Here, we should have conditions like ‘Drank’, ‘Unknown’, ‘Formerly_Drank’, and ‘Never_Drank’. With this, we can create a chart for any condition which means creating different charts.
Output
Using the Localhost URL, you can see the output of the program on any web browser.
There are a few steps that you need to follow to build the real-time live dashboard, which are explained in detail below:
1. Importing libraries and reading input data
Certain libraries will be needed for building your dashboard:
- Streamlit (st) - this is used for building a web application or a live dashboard
- Time, NumPy (np) - this is used when you don’t have a source for your data and you have to simulate a live data feed. You can use NumPy for generating data and making it live with the Time library.
- Pandas (pd) - you can use it for reading the input data source. You will be using the .csv file.
Now, we will look into the simple snippets that will help us to import all the required libraries for a live dashboard:
You can read these input data from the csv file using the command pd.read_csv(). However, make sure that the data source is live streamable from an API, XML object, a JSON, or a CSV, which will get updated regularly.
Next, you should add the pd.read_csv() command within a new get_data() function, so that it can get cached properly.
Caching is adding the decorator @st.experimental_memo function which will make the function get_datat() run the data one time. After that, whenever you rerun your application, the data will still be in the memory. It will help in avoiding and downloading the dataset each time you want to use it.
2. Making a basic dashboard setup
Now, we can set up a basic dashboard using the st.set_page_config() function with parameters that can fulfill our purpose:
- The web application title can be created using the page_title in the HTML tag <tag> and browser tab.
- The favicon uses the command page_icon in the browser tab.
- The layout = “wide”, will render the web application or live dashboard with a widescreen layout.
3. Designing a user interface
The interactive dashboard contains the basic UI designing components like:
- Top-level filter
Firstly, when you are creating a filter using the st.selectbox() function, it will help you display a dropdown with a list of options. To generate it, you should take the unique elements of the column from the data frame df. The selected items will be saved under the object name job_filter:
Now, if you have filtered, UI will be ready for using the job_filter function that will help you in filtering the data frame df.
- Interactive charts
You can now split your layout into different columns and fill them in the charts. Unlike the above function, you must use the ‘with’ clause to fill in the interactive chart to the columns:
- Density_heatmap
- Histogram
- Page title
The title is rendered as the h1 tag for displaying the title. Use st.title() function. It will make you take the string “Real-Time Dashboard” and display it in the Title.
- KPIs or summary cards
Before designing your KPIs, you should divide your layouts into columns using the st.columns() function. The columns can be created using the st.metric() function, which will help you create a KPI card. Use it for filling one KPI in each column.
The st.metric() function will help you display the KPI title. The value ** is the argument that will help you show the actual value and will have add-ons like delta which will compare the KPI value with the goal.
- Data table
You can display the data frame using the st.dataframe() function. Note that your data frame will get filtered as per the filter option you selected. You can use the below code for filtering the options:
4. Refreshing the dashboard as to the live data feed
As you can see, you don’t have a live feed yet, but you can stimulate your existing data frame. To do so, use the for loop from 0 to 200 seconds so that you will have an option on each iteration.
Inside the loop, you can use the NumPy random.choice command for generating a random number between 1 and 5. You can use it for multiplying the values of the drinking habits and fitness columns which you used for metrics and charts.
5. Auto-updating components
For displaying the live data feed using auto-updating KPIs and charts, you can put these components inside a single container using the st.empty() function. You can call it with the placeholder:
By putting your components into the placeholder and using it with the clause, you will be able to replace them on each iteration of the data update. The code below will help you understand the placeholder.container() function better along with its UI components which you have created.
To run the above-created dashboard on your local machine, follow the steps below.
- Save the code into a single app.py file.
- Open your Command Prompt using the same path where the app.py file is stored.
- Executing streamlit run app.py command for the dashboard to start running on your local machine. Then, the link will be displayed which you can open in a new tab.
The below example will help you understand the interactive dashboard creation with step-by-step instructions:
Step 1: Set a title and description for the dashboard main page using the below functions:
Step 2: Now, create a sidebar with a simple title and description.
Step 3: You can use the Pandas Library to read the .csv file and create a data frame. Use the data set for demonstration.
Step 4: Streamlit will provide you with some good functions for creating a select box with a small code. There are two arguments here, one for the title and another for forming a tuple using the below code.
Step 5: Here’s another method that will help you create a checkbox. It is as follows:
Step 6: You can use the selectbocx() function for creating a selectbox with four options in the below code.
Step 7: When you choose one option from the first selection box, its values get stored in the chart_visual value. The value will represent the chart type.
Using the second selection box, you can receive the values stored by making use of the selected_status variable. You can create the main graph with this value. You can also make conditions to draw the graphs with a simple if-else statement.
Step 8: When using the add_trace() command, you can find new traces to add to a graph object figure. Take a graph object trace as an argument and add it to the object figure.
Step 9: You can understand the output of the dataset with the go.scatter(), go.bar() commands for creating informative graphs. Firstly, you have to take the go.scatter() command that will take four arguments x_axis, y_axis, mode of the figure, and name for the new graph.
Step 10: Lastly, you can go to the go.bar() command to take three arguments like x_axis, y_axis, and the name of the new graph.
Streamlit can be used to build an interactive and beautiful dashboard for your website application. It requires zero website development expertise. You only need to understand how to load, explore, visualize, and interact with the given data. You can also generate these dashboards with very little code.
Streamlit is a simple and fast technique for visualizing your machine learning algorithm and creating an interactive dashboard in Python. The web application can be run without using any external web server because there will be an own server. It is also easy to deploy in a docker container.