
Complete Guide on Using Tableau for Data Science
•5 min read
- Languages, frameworks, tools, and trends

Tableau's origin dates back to 2013. The idea behind building Tableau was to have an application that would create databases, spreadsheets, and other sources of information in a way that the average person could easily perceive. The co-founders, Christian Chabot (CEO), Pat Hanrahan (Chief Scientist), and Chris Stolte (Chief Development Officer), began development by combining SQL for databases with a descriptive language to yield perceivable graphics.
In simpler terms, Tableau is a data visualization tool that is widely used for business intelligence (BI) and data analysis in the present era. Its versatility and ease of use is the reason behind its wide acceptance in the analytics and data science community. Even a professional without a background in business intelligence or analytics can create exceptional visualizations backed by a little guidance and practice.
Fun fact: Big brands like Nike, Skype, Tesla, Accenture, Coca-Cola, TCS, JPMorgan Chase & Co., Honeywell, GoDaddy, and many others use Tableau - a testament to its popularity.
This article will explore everything you need to know about Tableau.
Start with the installation
To use and learn Tableau for data visualization, begin by installing it. It comes in two versions - Desktop and Public.
- The public version is free and open-source, and is also used for trial purposes.
- Desktop is a premium licensed version that is available for technologies, departments, and industries.
Tip: You may want to try the public version first even if you intend to get the paid one later.
How to start?
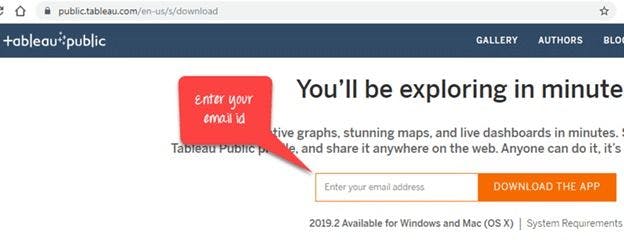
- Download any version from the link. Enter your email address in the ‘download the app’ bar.
- Once the file download is complete in the .exe extension, open it.
- Accept the terms and conditions and click on ‘install’.
- Tableau will open automatically once the installation completes.
Know Tableau’s products
Now that the installation is done, it’s time to get acquainted with Tableau’s products so that you can perform tasks efficiently.
1. Tableau desktop
With a 14-day trial version, this data visualization tool helps in creating interactive stories and dashboards. It’s suited for individual use and comes in two versions - tableau desktop personal edition and tableau desktop private edition. The first provides access to limited data and sharing capabilities. The professional version is more suitable for enterprise use and grants complete data access and sharing capabilities.
2. Tableau online
The on-cloud Tableau analytics platform is better defined as business intelligence in the cloud. It is a data-sharing tool that develops dashboards and uploads to Tableau online on the Tableau Desktop. The dashboard can be accessed from a mobile app and on the web. Colleagues and customers can view the dashboard with the link shared and make adjustments to it.
Opting for Tableau Online lets you save on hardware installation. The data is stored on cloud servers and maintained by Tableau groups. You can efficiently use functionalities like ask data, editing, interaction, data access and analysis, data management capabilities, and more.
Tableau Online has some additional benefits, one being no maintenance cost. The other is that users can connect to up to 40 data sources online. Some of them are MySQL, Amazon Aurora, Hive, Spark SQL, and others.
3. Tableau server
Tableau Server is much like Tableau Online. It’s used for sharing data like workbooks, dashboards, and reports data generated using Tableau Desktop applications across various teams. However, whatever has to be shared needs to first be published on Tableau Desktop. After this, it automatically gets loaded on the server.
A user does not need to have a server installed to use the uploaded reports. You can simply log in on any Tableau platform and access all the files. It’s best used as a collaboration platform in an organization.
Fun fact: If you ask questions in a natural language, you’ll receive AI-driven explanations for your data.
4. Tableau public
As the name suggests, this Tableau product is a free public platform. Anything created on it is shared publicly on the public cloud server.
There’s also a Tableau public community where you can view and analyze any information shared across the globe. You can also save dashboards and workbooks on it in the 10GB storage provided to each individual.
Journalists can make good use of Tableau Public. It’s also a great platform for people who wish to publish interactive data online and get their work noticed.
5. Tableau prep
This unique product is used for data preparation. The raw data is checked and made ready for presentation and analysis. It offers tools and interfaces with which the data can be combined, filtered, and transformed into usable forms. Since Tableau Prep is fairly easy to use, all levels of users can utilize it across organizations.
Tableau Prep comes in two versions:
- Tableau Prep Builder: Builds data flows.
- Tableau Prep Conductor: Share, schedule and manage the flows built in Tableau Prep builder.
6. Tableau mobile
If you want to use Tableau on mobile devices and tablets, this is the product to choose. It lets you work on workbooks and dashboards using touch gestures. You can select, filter, and drill down instantly on your mobile device.
Tableau Mobile automatically adjusts to screen dimensions. It’s also equipped with dashboard security, designing, searching, sharing, and alert capabilities.
Features and capabilities of Tableau
Here’s a look at Tableau’s many robust capabilities.
- Ask data: This unique feature of Tableau finds application in data sorting, filtering, and aggregations. A user only has to type a query in a natural language and the system will deliver immediate results.
- Connectors: You can find many data connectors like Google Ads, Snowflake connector, Microsoft Azure SQL Data Warehouse, etc., in the latest version of Tableau.
- Connections: You can establish strong and secure connections with Google Drive, OneDrive, Google BigQuery, and others.
- Install & deploy: Tableau lets you enhance its efficiency by offering features such as nested sorting improvements, mobile layout preview on the web, etc.
- Data sharing: Tableau reporting, dashboards, and visualizations can easily be exported as presentations on PowerPoint. You can also share Tableau results with a shareable link that redirects a user to the source workbook.
- Design view and visualizations: Some of the latest additions in the design view and visualizations feature of Tableau are heat map, transparent worksheet background, vector map, navigation buttons for dashboard, set actions, and Tableau navigation actions.
Now that you have detailed insights on how to use Tableau for data science, make the most of this excellent business intelligence tool. It offers superior security compared to many other BI tools, and helps reduce network traffic to enhance smooth functioning. With great end-user support, you can focus on strategic issues and even work with minimal hardware with certain Tableau products.